Visualization of content in BlueSpice MediaWiki
11. July 2019
It doesn’t always have to be text. To get an overview of information and to absorb knowledge quickly, a varied mixture of written and graphic content is recommended. Markus Glaser, CEO at Hallo Welt! GmbH, explains possibilities of visualization in the BlueSpice Enterprise wiki.
Markus, a Wiki is first of all a text-based medium, right?
“That’s right. In the corporate environment, a wiki is ideally suited for text-based documentation, organization manuals and management systems such as knowledge and quality management, i.e. basically for building a company-wide knowledge base.
To format the corresponding texts, there is a markup language that is used to format contributions in wikis: WikiText. This is much simpler than HTML and offers a lot of freedom in article design”.
With the visual editor it is even easier, without knowledge of markup languages, isn’t it?
That’s right. The visual editor maximizes user comfort. For example, lists, quotes and links can be created with one click, and font styles (italic, bold) and headings can be adjusted. The concept behind it: WYSIWYG. This means “what you see is what you get”. The user immediately sees what his formatting does in the text and can optimize Wiki content accordingly.

Display: The visual editor in BlueSpice
Does a company also need to present content visually or graphically?
Definitely. Written text is usually the main part of a wiki. However, BlueSpice also offers numerous possibilities to work visually. It is nothing new that audio-visual formats usually support the perception and processing of information and knowledge in a positive way. In this context we distinguish the following three possibilities:
1. upload of content to the Wiki
With a few clicks, individual pictures, picture galleries or videos can be uploaded or created in BlueSpice. Suitable formats are JPG or PNG files and MP4 or WEBM videos.
2. creating content in the Wiki
Images and ImageMaps
Images or visualizations of any kind can be overlaid with ImageMaps or HotSpots in BlueSpice. If the user moves the mouse over a HotSpot, he will be forwarded to any target page via a link. This procedure is suitable for complex technical visualizations and corresponding explanatory texts or videos for their individual components, for example. Interesting information on this topic can be found at MediaWiki.org.
Tables
Tables are a frequently used medium for the structured representation of (complex) contents. With BlueSpice 3.1 the formatting of tables is optimized. Among the new features are:
- the change of the background and font color
- the text alignment incl. vertical text
- the assignment of predefined table styles (frame thickness and color, background color)
- the definition of table and column dimensions
Furthermore, tables can be sorted, filtered and exported.
Process diagrams with draw.io (extension)
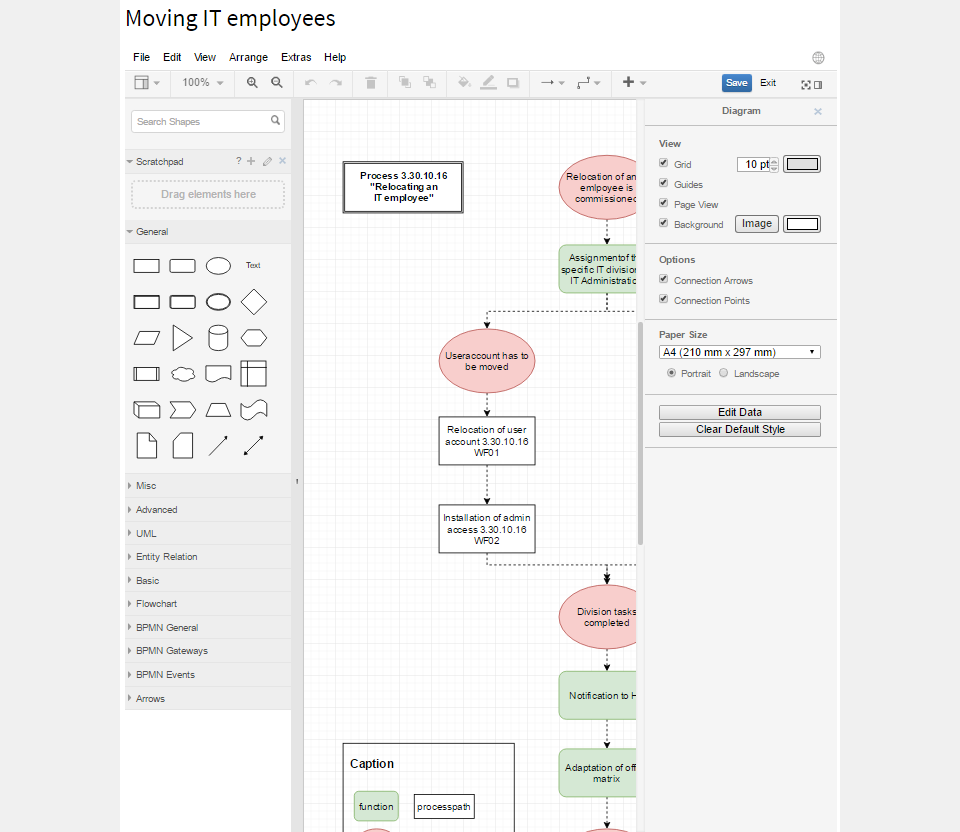
Flowcharts, process chains or decision trees are classics in corporate wikis. Just think, for example, of the complex process flows in quality management. Without appropriate visualization, the overview is lost very quickly. BlueSpice relies on an interface to draw.io to create and publish clear and complex graphics directly in the wiki. If a change is necessary, the representations in the wiki can be adapted and saved anew. This saves a lot of time, because the upload of the updated file into the wiki is not necessary.

Display: Draw.io in BlueSpice pro
Our Helpdesk also provides further information on the integration of draw.io:
https://en.wiki.bluespice.com/wiki/Manual:Extension/DrawioEditor
Good to know: Besides the just mentioned possibility to draw processes with draw.io directly in the Wiki, process diagrams can also be automatically generated in BlueSpice via semantic data (see below).
Tag cloud (extension)
With the tag cloud a category or keyword overview can be visualized graphically appealing (e.g. popular search terms). With this extension tag clouds as well as lists can be generated. The categories that are used most are always used as a starting point. The corresponding keywords are displayed larger or otherwise highlighted.
Graphical representation of user activities
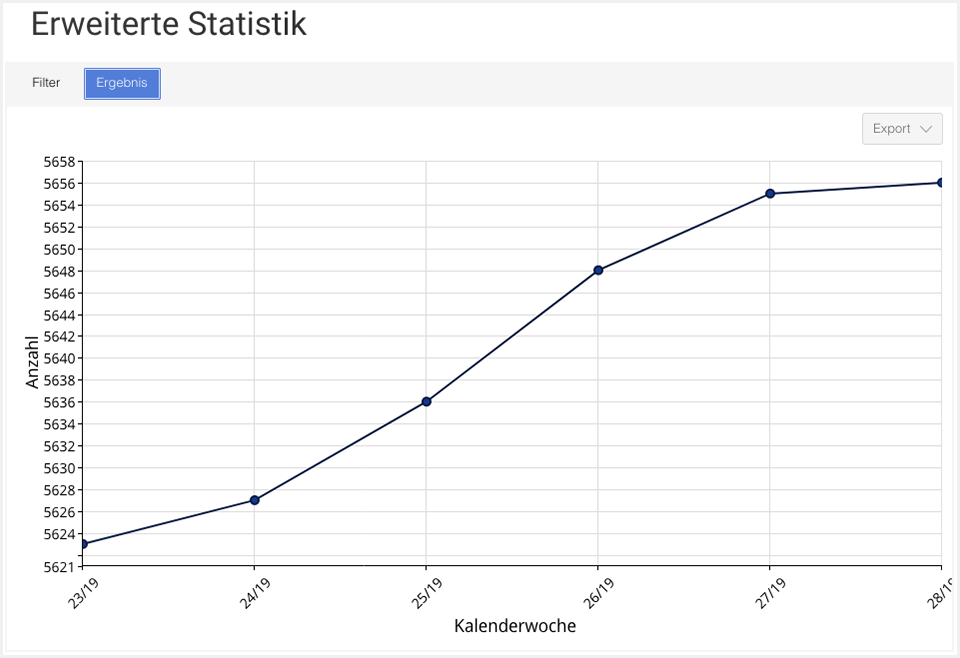
In BlueSpice various user activities can be evaluated and graphically displayed. This includes, for example, the number of pages created or search queries over a certain period of time. The generated representations can be exported in order to integrate them into another application, such as a presentation.

Display: Extended statistical data in BlueSpice
Visualization of semantic data
Data usually plays a major role in Enterprise Wikis. In this context, we speak of semantic or structured data, which is usually prepared in tabular form and is entered into the Wiki via “semantic forms”. The corresponding forms can be implemented by the customer himself. With our semantic training and semantic workshop we offer the corresponding know-how. Alternatively, we are happy to develop input forms and interfaces to existing databases on behalf of the customer. I would like to show three examples that illustrate the potential of semantic data:
Open Street Map
With the “Circles Parameter” you can mark and graphically highlight areas in OpenStreetMap map displays. For example, different locations or regional activities of a company can be marked on a global map and provided with further information.
Further information on this topic can be found here:
https://www.semantic-mediawiki.org/wiki/Extension:Maps/Displaying_maps

Representation: Embedding of Open Street Map in BlueSpice
Charts & diagrams
There are numerous ways to generate charts from data. The following example shows an example bar chart with labels on the X and Y axes. But pie charts and other graphical output formats are also possible.
You can find more information here:
https://www.semantic-mediawiki.org/wiki/Demo:Jqplotchart/Distributable_data

Display: Column and pie charts in BlueSpice
Timelines
With the help of the appropriate extension, time sequences can be graphically displayed in BlueSpice, e.g. to illustrate the company history, a strategic plan or important milestones in a project.
You can find further information here:
https://www.semantic-mediawiki.org/wiki/Help:Timeline_format

Display: a graphical timeline
3. Embedding of content in the wiki
Besides the already mentioned possibilities of uploading content to the wiki and creating content in the wiki itself, I would like to briefly discuss the possibility of embedding content using so-called widgets. A widget is a small computer program that embeds third-party content into the graphical user interface of BlueSpice. Typical examples are:
- YouTube/ Vimeo-Videos
- Slideshare presentations
- Podcasts/ audio files
- Google Maps or OpenStreetMap
But “exotic” video players such as Brightcove or other tools for creating process diagrams can also be integrated via widgets. There are a variety of ready-to-use widgets optimized for MediaWiki. These can be found here (login required):
https://www.mediawikiwidgets.org/Widgets_Catalog
Embedding in BlueSpice is also possible via APIs (Application Programming Interface). For example, the connection of a Lotus Notes database or SharePoint document lists is conceivable. In this case, our programmers are available with help and advice to finally achieve the optimal result for the customer. Because that is always the most important thing for us.
Share This Story, Choose Your Platform!
| Except where otherwise noted, news on this site is licensed under a Creative Commons Attribution 4.0 International license. |


